Research Manager
SHIOTA DaikouPh.D. (Science)
He received his Ph.D.(Science) degree from Kyoto University. After working at the National Astronomical Observatory of Japan, the Japan Agency for Marine-Earth Science and Technology, RIKEN, and Nagoya University, he joined NICT in 2017. He also serves as a visiting associate professor at the Institute for Space-Earth Environmental Research, Nagoya University. He is engaged in research on solar storms and the development of numerical simulations for forecasting the effects of solar storms.
- Home
- Researchers
- SHIOTA Daikou
Prediction of Effect of Solar Storms by Numerical Simulation
Toward Forecasting Impacts of Solar Storms based on Understanding of Their Physics
Solar storms and space weather
Space weather refers to the environmental changes in space around Earth, including the ionosphere. Space weather fluctuates owing to the effects of phenomena originating from the Sun. Very large space weather disturbances sometimes have several effects on human society, not only radiation exposure to astronauts and the failure of artificial satellites, but also disturbances in ground communications and GPS positioning, and, in rare cases, affect aircraft at high altitudes and transmission networks on the ground. The main causes of these effects are solar storms, that is, solar flares coinciding with coronal mass ejections (CMEs), in which a large amount of corona gas (plasma) is emitted from the Sun to interplanetary space.
In addition, solar storms often emit solar energetic particles (SEPs) into interplanetary space. Because CMEs and SEPs propagate through interplanetary space, they can reach and affect Earth's space weather depending on where the solar storm occurs in the solar corona relative to Earth. As a recent example, a huge solar storm occurred on September 6, 2017. Two days later, disturbances to communication and an increase in GPS positioning error were observed in Japan, drawing public attention. In addition, on September 10 of the same year, a large-scale solar storm accompanied by the emission of SEPs occurred, and an increase in the exposure dose at aircraft altitude was estimated, but it did not reach a level that affects human bodies.
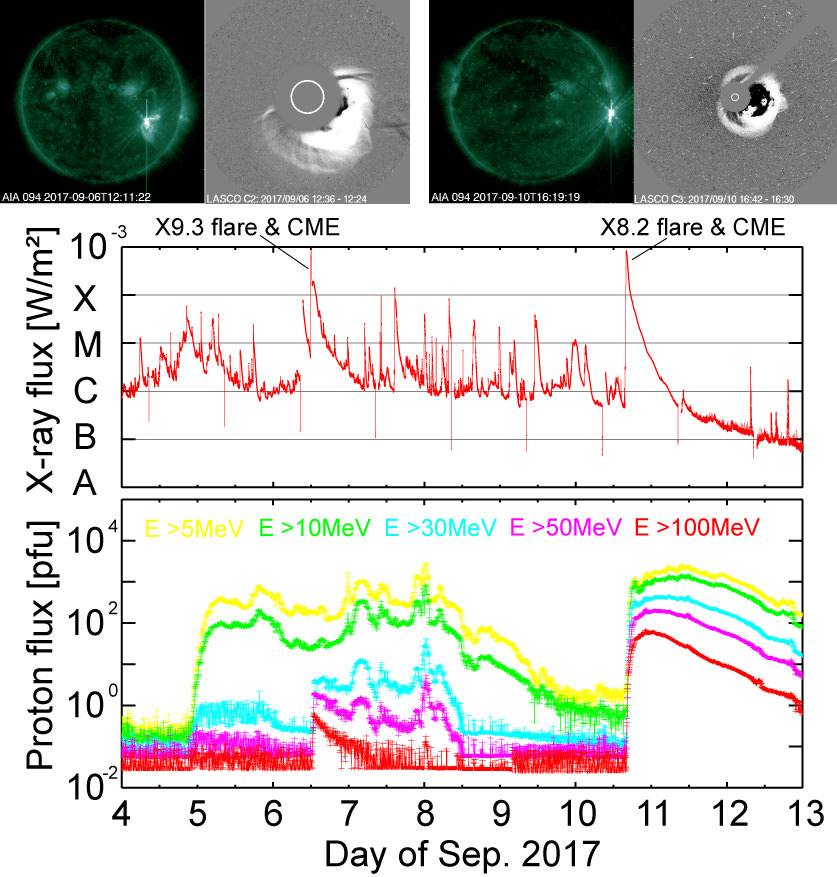
Figure 1. Solar flare with CMEs and SEPs in September 2017
In such extremely large solar storms with a large amount of SEPs, some of the SEPs reach Earth and some of them penetrate deep into the atmosphere. As a result of their reaction with the atmosphere, the amount of radiation in the atmosphere increases. Since the radiation coming from outside Earth is absorbed by the atmosphere, the exposure dose decreases as the altitude decreases. Therefore, the exposure dose is greater at the altitude of aircraft than at the ground level. In addition, the SEPs with charges tend to be more concentrated in high-latitude regions because they are guided by the magnetic field lines in Earth's magnetosphere. Our group has developed and started operating a system (WASAVIES) that estimates the exposure dose rate at the altitude of aircraft in real time, as shown in Fig. 2. When a SEP increase event associated with a solar storm occurs together with increases in radiation observed with neutron monitors on the ground, maps of the exposure dose rate are updated every 5 minutes during the SEP event.
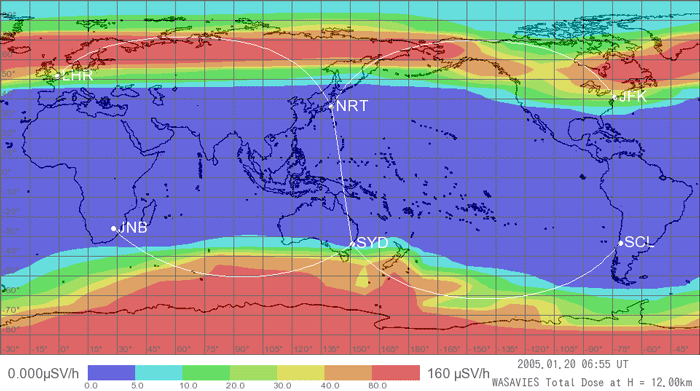
Figure 2. Estimated exposure dose distribution due to space and solar radiation at aircraft altitudes during a past large-scale solar storm
Learning about past space weather for improvement of space weather forecast
The solar storm of September 2017 was the largest event in recent years. However, there are records of even more serious impacts on society caused by large solar storms. For example, a series of solar storms in March 1989 led to about 6,000,000 people in Quebec, Canada, suffering from electricity blackouts. An even larger event was found to have occurred in 1859. At that time, auroras were observed in low-latitude areas such as Hawaii. A phenomenon of the same scale occurring in the present day would be a major disaster, having a serious impact on the global social infrastructure, which is much more advanced than it was in 1859.
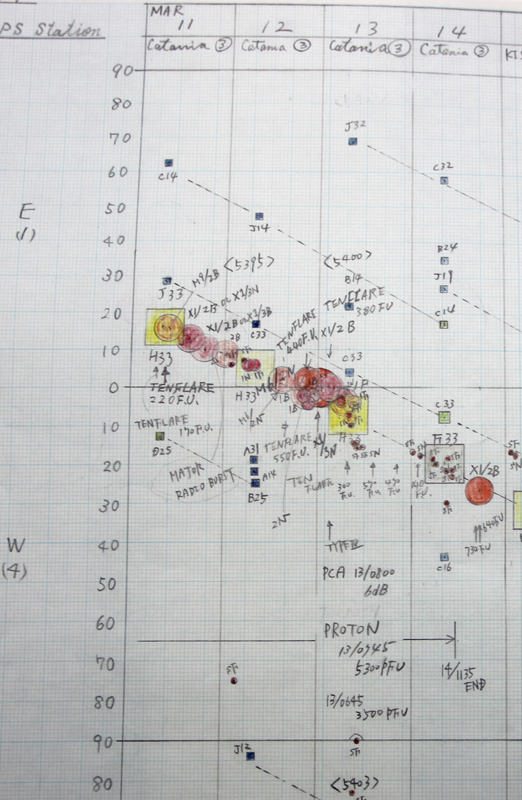
Handwritten space weather monitoring records
The Space Environment Laboratory monitors space weather from the Sun to the ionosphere and provides space weather forecasts every day. Although space weather forecasts have now been provided for over 30 years, space weather monitoring activities have continued for more than 70 years, starting at the former Radio Research Laboratories. Our laboratory has maintained a record of space weather monitoring since that time. Using these historical records, we are conducting research to uncover past large solar storms and their effects, and we aim to use these records as data for future space weather forecasts.
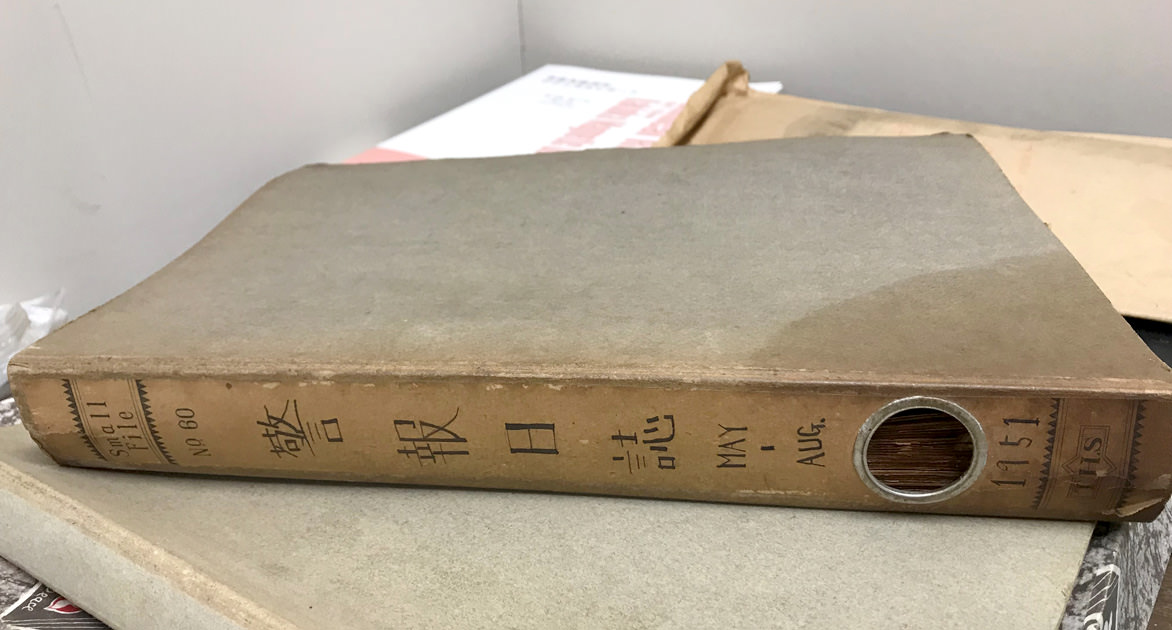
Materials from the Space Environment Laboratory used nearly 70 years ago
Prediction of effects of solar storms
Very large solar storms that can have a serious impact on society should be considered as natural disasters. We are developing a system to predict the arrival of the effects of solar storms and the magnitude of their impact in advance of their actual arrival.
A CME is a phenomenon that can have very serious impacts, as mentioned earlier. CMEs propagate outward from the solar corona to the interplanetary space of the solar system while dragging the magnetic field of the solar corona. If a CME approaches Earth, its effect on Earth will strongly depend on the direction of the magnetic field inside the CME. The magnetic field of Earth's magnetosphere usually acts as a barrier, preventing the plasma from the Sun from entering the magnetosphere. However, this barrier function is weakened when the plasma approaching Earth has a southward magnetic field, allowing the energy of the plasma to enter the magnetosphere and cause a major disturbance.
Design of numerical simulation
Thus, to predict the effect of solar storms on Earth's space weather, it is necessary to accurately predict CMEs and the magnetic field inside them. It takes one to five days for a CME to reach Earth by propagating through interplanetary space after its launch from the solar corona. In other words, it is possible to take measures in advance on the basis of a prediction made immediately after a solar flare is observed. However, it is not easy to predict the propagation time and the direction of the magnetic field reaching Earth. This is because of the insufficient observation of CMEs and the incomplete understanding of the physical processes in the early phase of solar flares and CMEs and also in the propagation of CMEs in solar wind in interplanetary space.
Therefore, we have been developing a system that predicts the flow of plasma and the magnetic field reaching Earth. In a numerical simulation of the system (SUSANOO), we are reproducing the three-dimensional distribution of solar wind in interplanetary space on the basis of magnetic field observation of the solar surface and also reproducing the process of propagating CMEs containing a magnetic field into the solar wind (Fig. 3). We are conducting R&D to improve the prediction accuracy and numerical simulation while also conducting research to promote understanding of the physical processes.
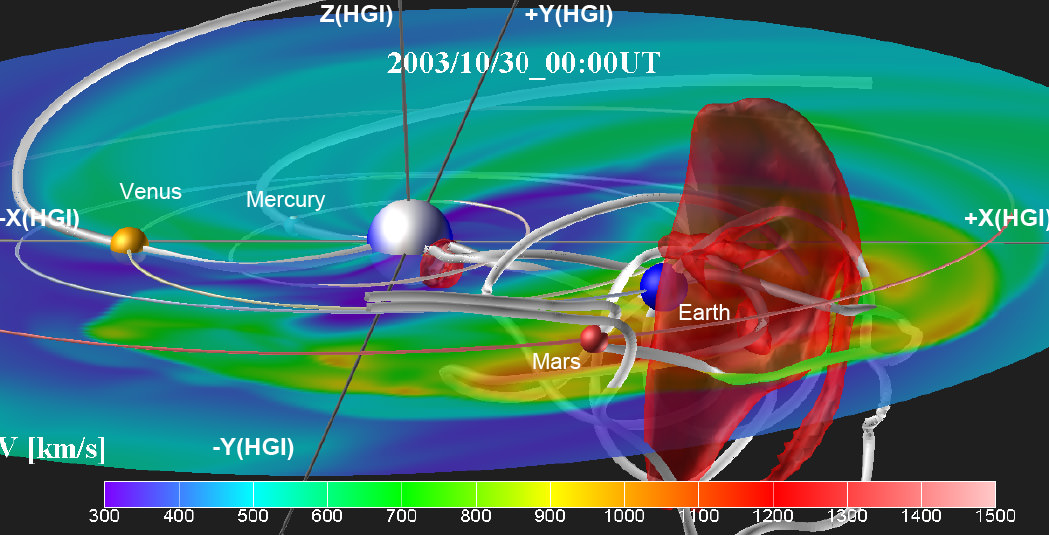
Figure 3. Magnetohydrodynamic simulation of a solar storm (CME) propagating in solar wind, showing magnetic field lines and velocity fields as a giant solar storm passes around Earth on October 28, 2003. The background color represents the velocity distribution, and the white tubes represent magnetic field lines. The red surface is the region of high-speed plasma flow (1200 km/s) associated with the shock wave in front of the CME. The Sun is at the origin of the coordinate system, and the colored spheres indicate the positions of the planets at this time.
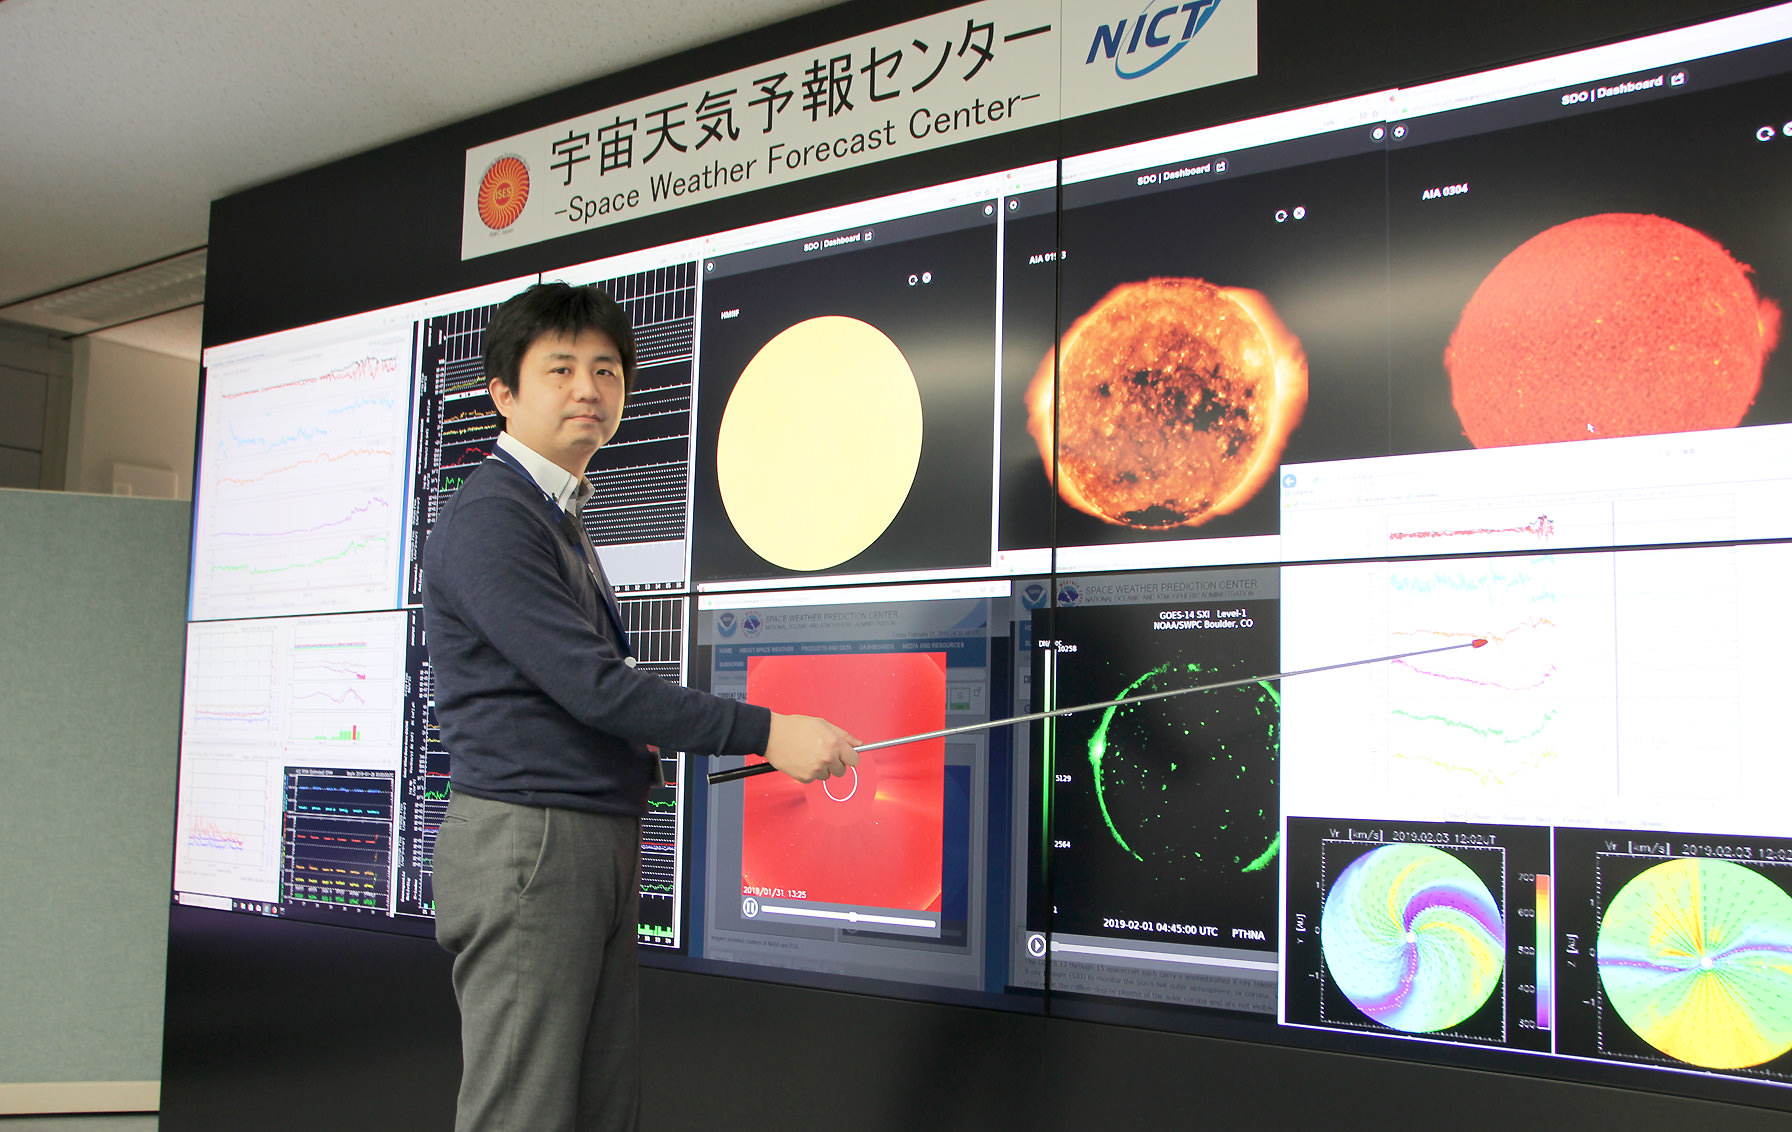
At the Space Weather Forecast Center
- Home
- Researchers
- SHIOTA Daikou