Senior Researcher
NAKAMIZO AoiPh.D. (Science)
She received her Ph.D.(Science) degree from Kyushu University. After working at Kyushu University (JST researcher), Nagoya University, and Finnish Meteorological Institute (senior scientist), she joined NICT in 2014 and was assigned to Radio Research Institute in 2015. She is engaged in research on the magnetospheric dynamics and the magnetosphere-ionosphere coupling.
- Home
- Researchers
- NAKAMIZO Aoi
Toward the Understanding the Mechanism of Substorm
Development of the Magnetosphere Simulator with Self-consistent
Magnetosphere-Ionosphere Coupling Algorism
What is the Space Weather?
Whereas weather forecast is a part of our daily modern life, we are rarely concerned with daily conditions far above the sky. However, the modern civilization heavily counts on the utilization of the near-Earth space, “Geo-space”, as manifested by communication/broadcast satellites, weather forecast satellites, and global positioning/navigation satellites. You may imagine that the space is “quiet.” In fact, the space we are utilizing is a very dynamic place.
Sometimes “space storms” occur there. “Space Weather Science” is a research field that aims at understanding and forecasting the conditions of Geo-space, that is, “Space Weather”. We introduce our research activities starting with the outline of “Solar-Terrestrial Physics”, the foundation of Space Weather Science.
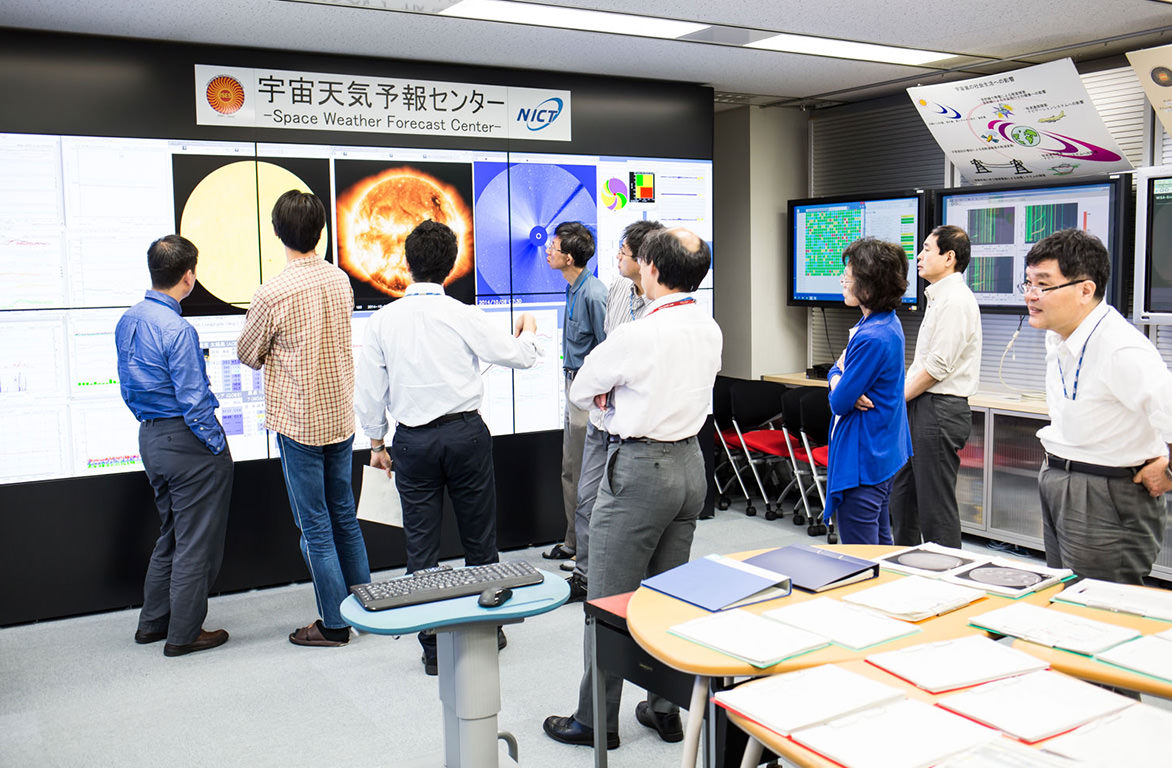
Space weather forecast meeting
From Solar-Terrestrial Physics to Space Weather Science
“Solar wind”, supersonic plasma flow with solar magnetic field, the extended solar atmosphere blowing from the solar surface by heating near the Sun competing over strong gravity, is one of the most important processes of the solar energy release toward the space. The solar wind prevailing the heliosphere is not steady. Background structure itself rotates along with the solar rotation and “Coronal Mass Ejections (CMEs)” associated with solar flares sometimes dominate the overall structure.
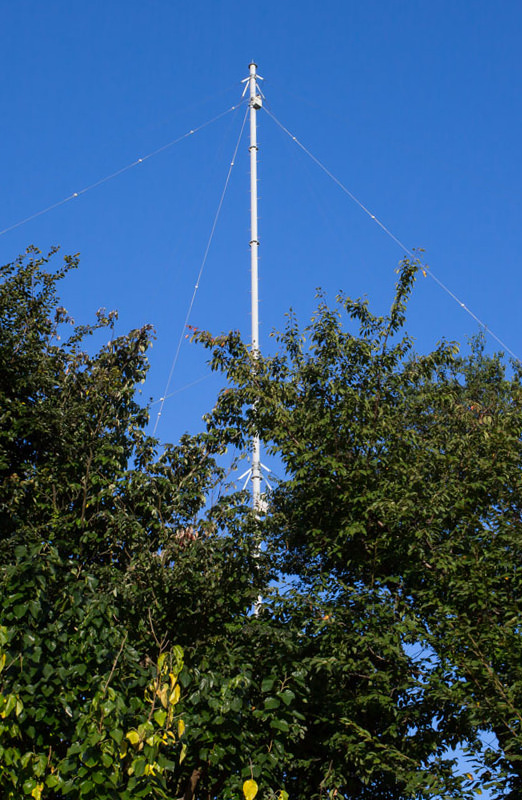
Ionosonde antenna
Every planet in the solar system is affected not only by the sunlight but also by the solar wind. As the result of interaction between the solar wind and planetary magnetic field/atmosphere, each planet forms its own “planetary space”, the details of which are different depending on the existence of the planetary magnetic field and atmosphere.
As for the Earth, a magnetized planet having its own atmosphere, “Earth's magnetosphere,” having characteristic configuration of plasmas and magnetic field, and “Earth's ionosphere”, weakly-ionized topside atmosphere, are formed surrounding the Earth (abbreviated respectively as the magnetosphere and ionosphere below). The magnetosphere and ionosphere always change under non-steady solar wind conditions, and their responses are complex.
Solar wind and the outer magnetosphere are regions to which magneto-hydro dynamics (MHD) description can be applied. On the other hand, kinetic description is necessary in the inner magnetosphere including the radiation belt due to the existing high-energy plasmas. Electromagnetic disturbances in the solar wind, outer and inner magnetosphere are transmitted to the Earth via magnetic field lines. Here, what each different plasma region shares as the inner boundary condition is the ionosphere. The facts that it is a weakly-ionized gas system in contrast to other fully ionized gas (plasma) systems and that its time and spatial scales are different from other regions make the ionosphere not a simply passive boundary but an active one. Solar-Terrestrial Physics is the research field which conducts the synthetic study for phenomena developing in the solar wind-magnetosphere-ionosphere system under the outer driver (the solar wind) and active inner boundary condition (the ionosphere), including the universalities and scale coupling of magnetic fluids, high-energy plasmas, and weakly-ionized gas.
As the solar wind energy flowing into the magnetosphere increases, the magnetosphere-ionosphere (M-I) interaction becomes more activate. As a result, the M-I system is significantly disturbed accompanied by global structure change, enhancement of radiation and the ring current in the inner magnetosphere, intensification of ionospheric currents, and so on. Space storm is the collective term for those disturbances. Human being living below the atmosphere sees end effects of space storms such as aurora borealis, ionosphere and thermosphere irregularities manifesting the dynamically changing Geo-space. Upper Atmosphere Physics emerged for understanding these signatures. Through IGY (International Geophysical Year) in 1957 and space exploration started in 1960s the research field developed to Solar-Terrestrial Physics, which recognizes the Sun-solar wind-magnetosphere-Ionosphere as a system.
Together with the utilization of the Geo-space and advancement of social infrastructure, the research target domain has been including the territory of human activities, and phenomena occurring there directly have affected our daily life. Today Solar-Terrestrial Physics has been deeply related to the modern society as Space Weather Science which aims at understanding and forecasting the condition of the Geo-space environment, Space weather. It is especially an urgent task to forecast space storms which cause serious communication damages.
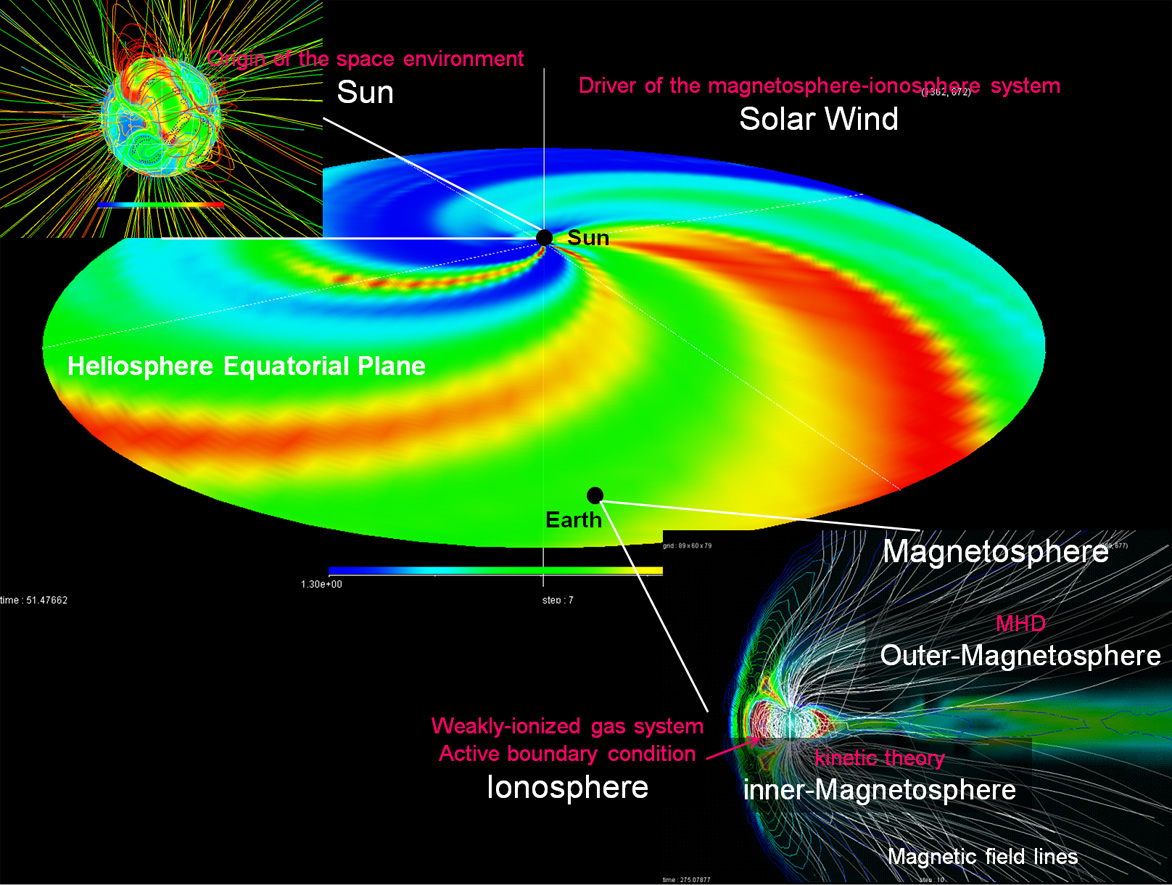
Figure 1.
Overview of the Solar-Terrestrial System. The solar wind originating from the sun and prevailing the heliosphere has a spiral structure due to the solar rotation. The Earth's magnetic field is deformed by the solar wind, forming the magnetosphere. Topside atmosphere weakly ionized by solar radiation forms the ionosphere. The coupled magnetosphere-ionosphere system responses to ever-changing solar wind.
Observation and Numerical Simulation
The keys to effectively obtaining a perspective on the space environment are “observed object” and "travel time" which a phenomenon occurred/observed at the observed object will take to travel to the magnetosphere.
The observed objects are the Sun, the origin of the space environment, and the arriving solar wind which will actually impact on the magnetosphere. The solar activities can be monitored by observing the Sun by instruments on the ground and onboard satellites. The arriving solar wind can be known by satellite (in-situ) observation at the Lagrange point 1 (Lagrange points 1 to 5 are the gravitationally stable points in the two-body problem. The Lagrange point 1 lies between the Sun and Earth). Then consider travel times. The distance between the Sun and Earth and that between the Lagrange point and Earth are 150 and 1.5 million kilometers, respectively. At its average velocity (about 400km/s) the solar wind reaches the magnetosphere about three days after it originates from the Sun, and about an hour after it passes the Lagrange point. Summarizing the above, we infer three days in advance the arriving solar wind conditions from the solar observations, then foresee an hour earlier how the magnetosphere and ionosphere would respond based on actual measurements of the solar wind at L1. The actual condition of the magnetosphere and ionosphere is understood by integrating various data obtained by ground magnetometer networks, low-altitude satellites, geo-stationary-orbiting satellites, satellites in the deep magnetosphere, and so on. Observations from the Sun to the ground has been developed and maintained by efforts and international cooperation among research institutes worldwide. We operate a solar radio observatory (in Ibusuki, Kagoshima), a receiving antenna of the solar wind observation satellites ACE and DSCOVR (in Koganei, Tokyo), and conduct the Geo-space observation with ground magnetometer network, HF radars, and so on. We have also continued regular ionospheric observations for a long term in Japan, and carried out ionospheric observations in southeast Asian regions under the cooperation with the local institutes.
The supercomputer for simulations
The basis for understanding the nature is the observation. However, it is difficult to fully understand the vast space only with measurements at limited and sparse observational points. Besides, the space cannot be imaged from the outside. Furthermore, observations can tell us the past and current but not the future. Empirical predictions have a limitation for practical use.
Our laboratory recently started simulation studies and has developed three global models. The atmosphere-ionosphere coupled model, GAIA, calculates the whole atmospheric regions including ionosphere with inputs from re-analyzed meteorological data, solar irradiance, electromagnetic fields transmitted from the magnetosphere, and so on. The magnetosphere MHD simulator is driven by the solar wind data. However, the future magnetosphere can be predicted only an hour in advance at best if we rely on the solar wind observed at L1, as noted above. In order to enhance this leading time, we have developed the solar wind MHD simulator which reproduces the heliosphere three-dimensional structure based on the Sun's photosphere data.
We have promoted the improvement and synthesis of these simulators in order to serve the society. However, there are still various phenomena which never be reproduced only by improvement of global simulators. Therefore we are also developing a solar flare prediction model, solar energetic particle transport model, radiation belt electron forecast model, and super-high-resolution ionosphere model. (see Web page of our laboratory.)
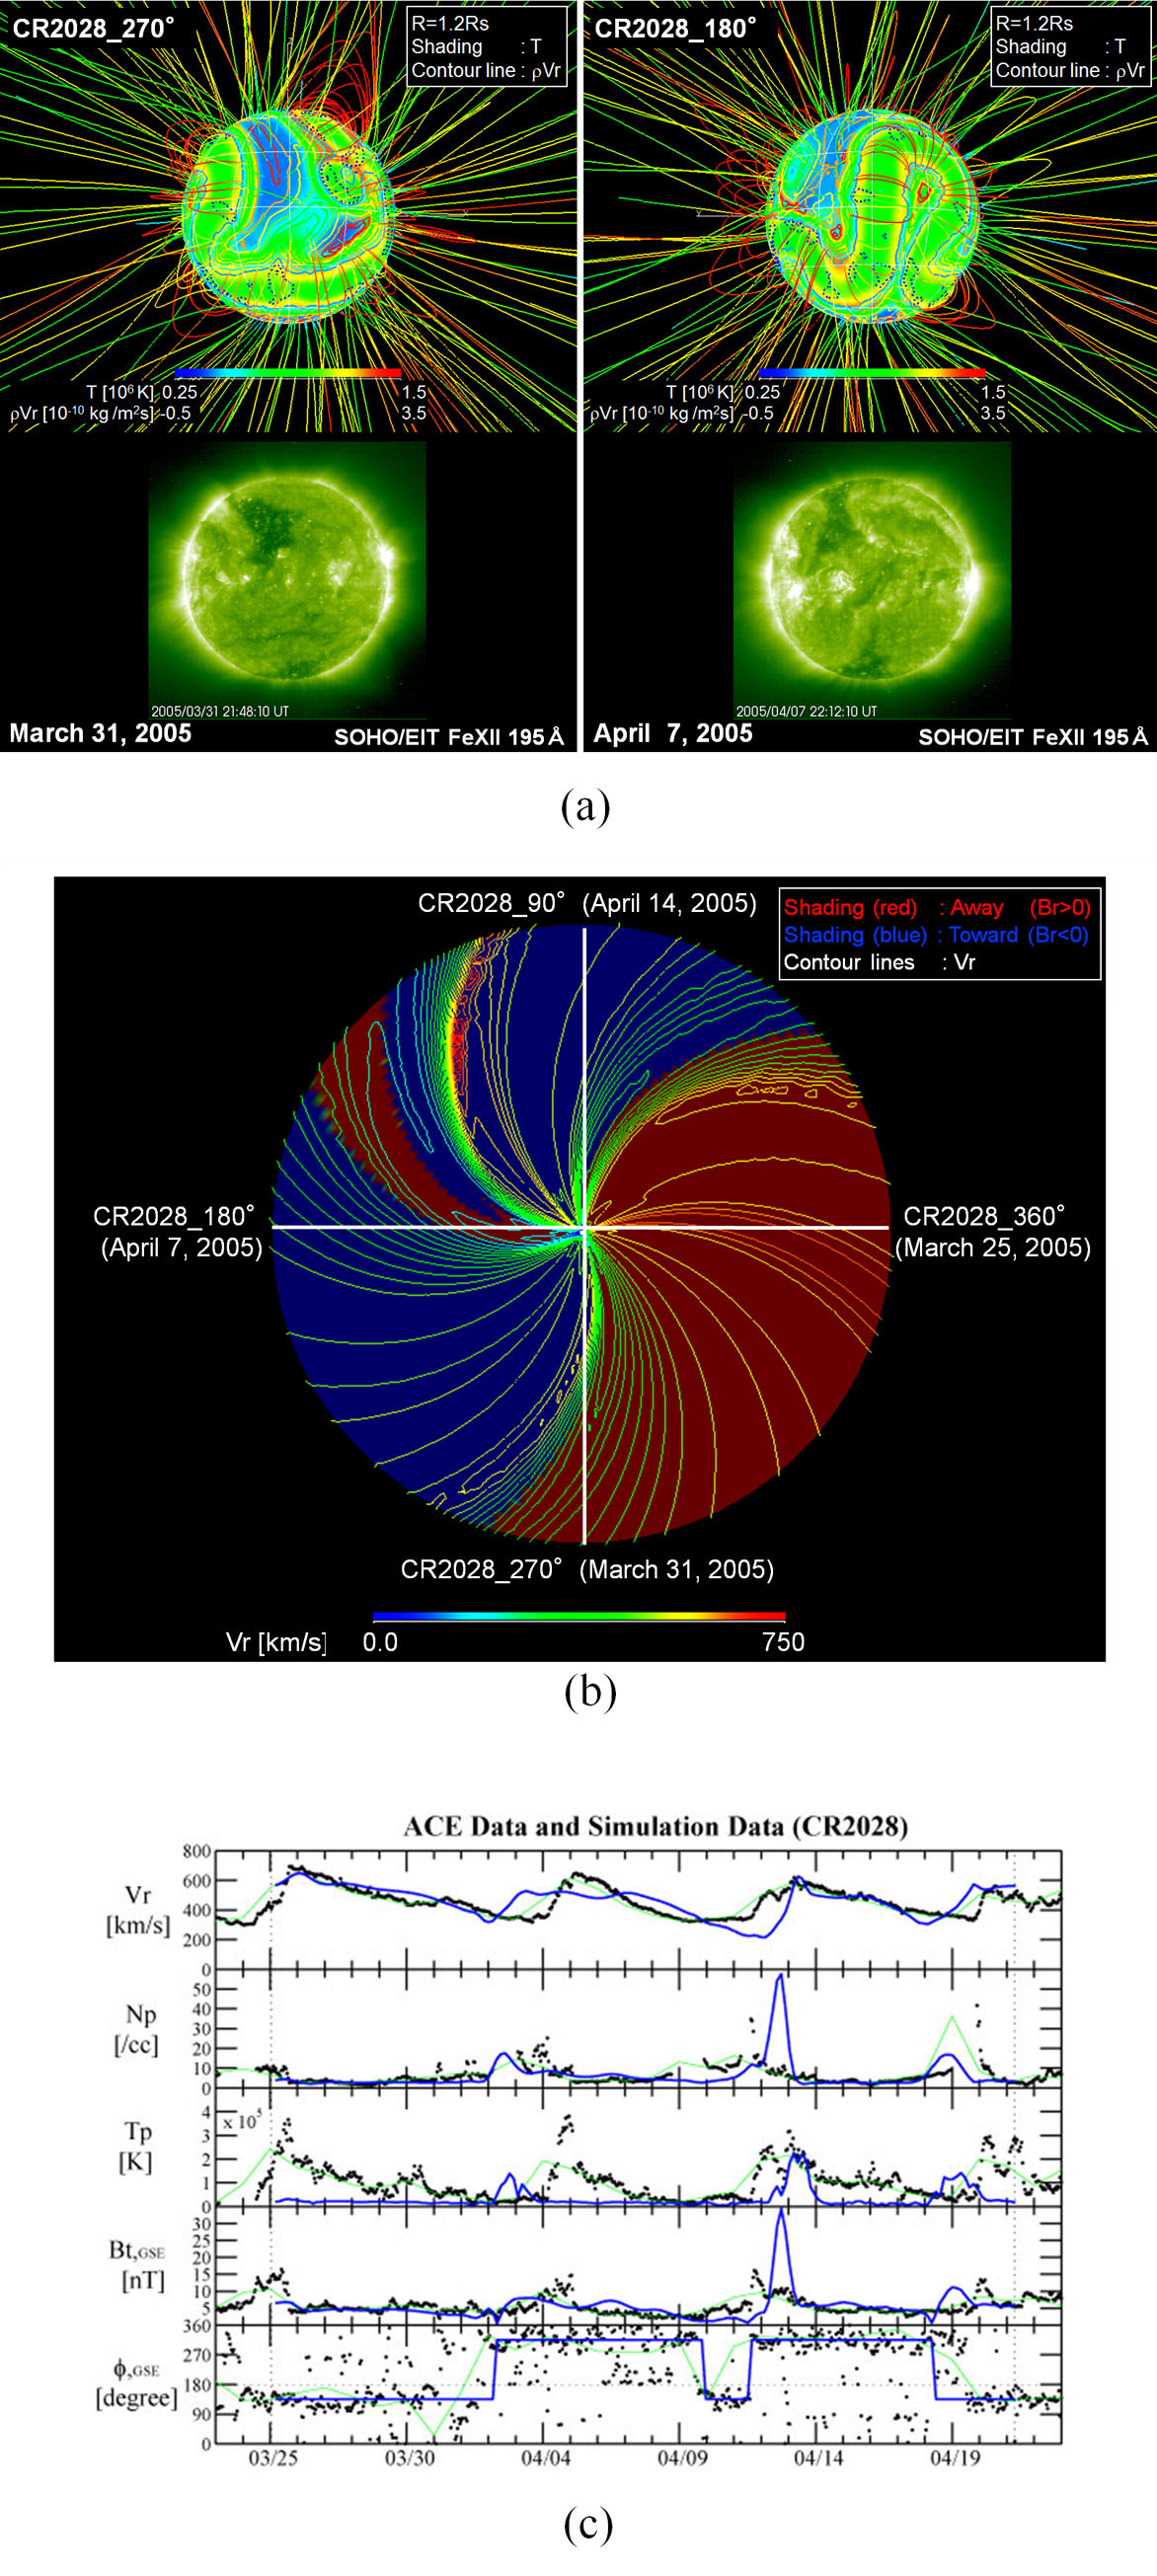
Figure 2.
The Sun-solar wind system reproduced by the global 3-D MHD simulator.
(a) Close-up views of the calculated solar surface-inner corona system for Carrington Rotation 2028. The longitudinal center is set to 270°and 180° in Carrington coordinates. These correspond to the sun visible from the Earth on 31 March and 7 April 2005. Color shading and contour lines show temperature and radial mass flux distribution on the sphere at the radius of 1.2 Rs. The temperature distribution in the corona is also shown by color codes on field lines. Images taken by SOHO/EIT on the corresponding days are also shown as a reference.
(b) Calculated solar wind structure in the heliospheric equatorial plane. The sun is located at the center of the plane and the outer circumference corresponds to the circle of radius at 200 Rs, which is close to the terrestrial orbit. White lines indicate the Carrington longitudes 360°, 270°, 180°, and 90°; these longitudes faced the Earth on 25 March, 31 March, 7 April, and 14 April, respectively. The contour line shows the radial component of the solar wind velocity. Color shading shows sector polarity: away polarity with red and toward polarity with blue.
(c) Comparison between the simulation data and the observational data obtained by the ACE satellite. The horizontal axis is the time from 29 March to 24 April 2005. Vertical dotted lines indicate the start and end of the CR2028. Shown from the top to bottom columns are the radial component of the solar wind speed Vr, the plasma density Np, the plasma temperature Tp, the magnetic field magnitude Bt, and the angle between the magnetic field and the GSM-X axis f, indicating the sector polarity. Black dots are 1-hour averaged ACE data, green solid lines are 1-day averaged ACE data, and blue solid lines are the simulation data.
Aurora Breakup Phenomenon, Substorm
I am mainly conducting the magnetosphere MHD simulation. Although magnetosphere simulators have been developed at many research institutes (in U.S., European countries, and Japan), no simulator has been able to reproduce the space storms sufficiently for practical use. The magnetic diffusion effect, anomalous resistivity, realistic geometry, and numerical problems are possible areas for improvements. The more important challenge is the self-consistent description of the M-I coupling. I am planning to improve the simulator in collaboration with scientists here and abroad. My goal is to elucidate the mechanism of the auroral breakup, a manifestation of fundamental energy releases of the M-I coupled system but an unsolved mystery for 50 years, substorm.
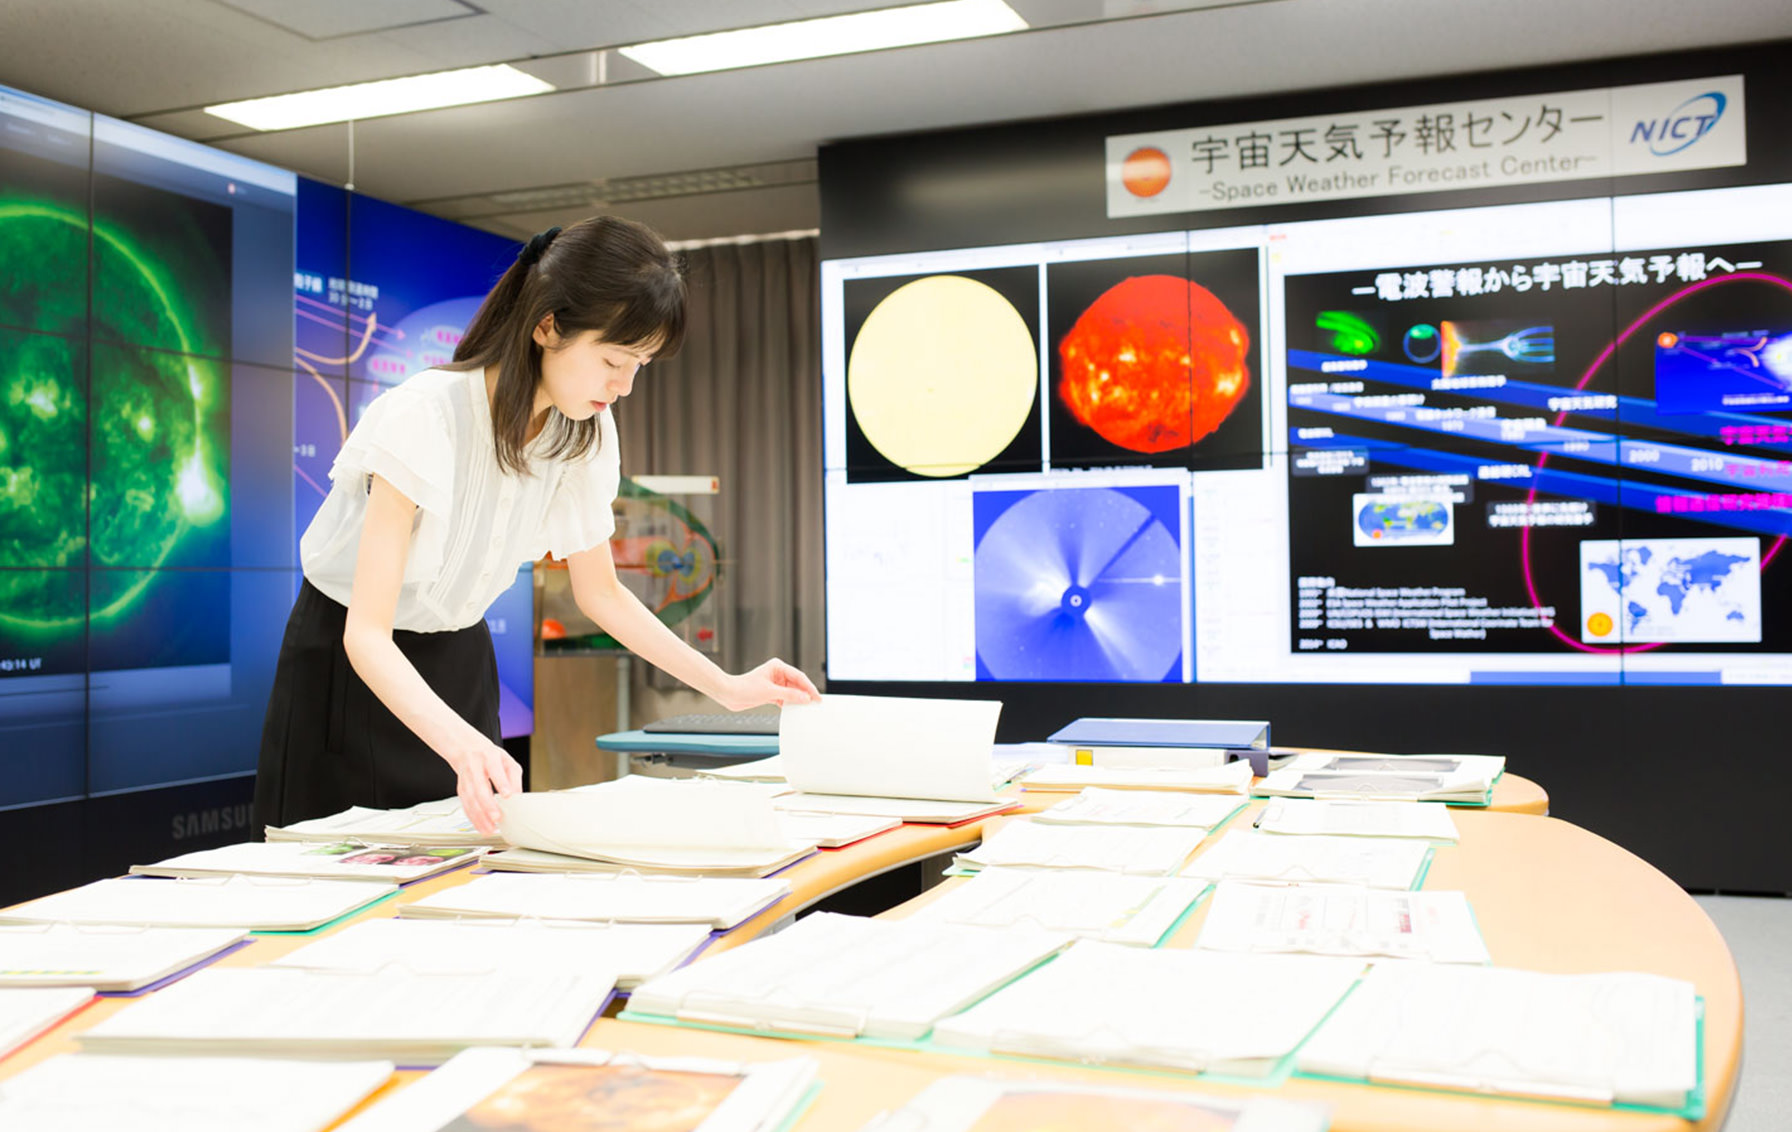
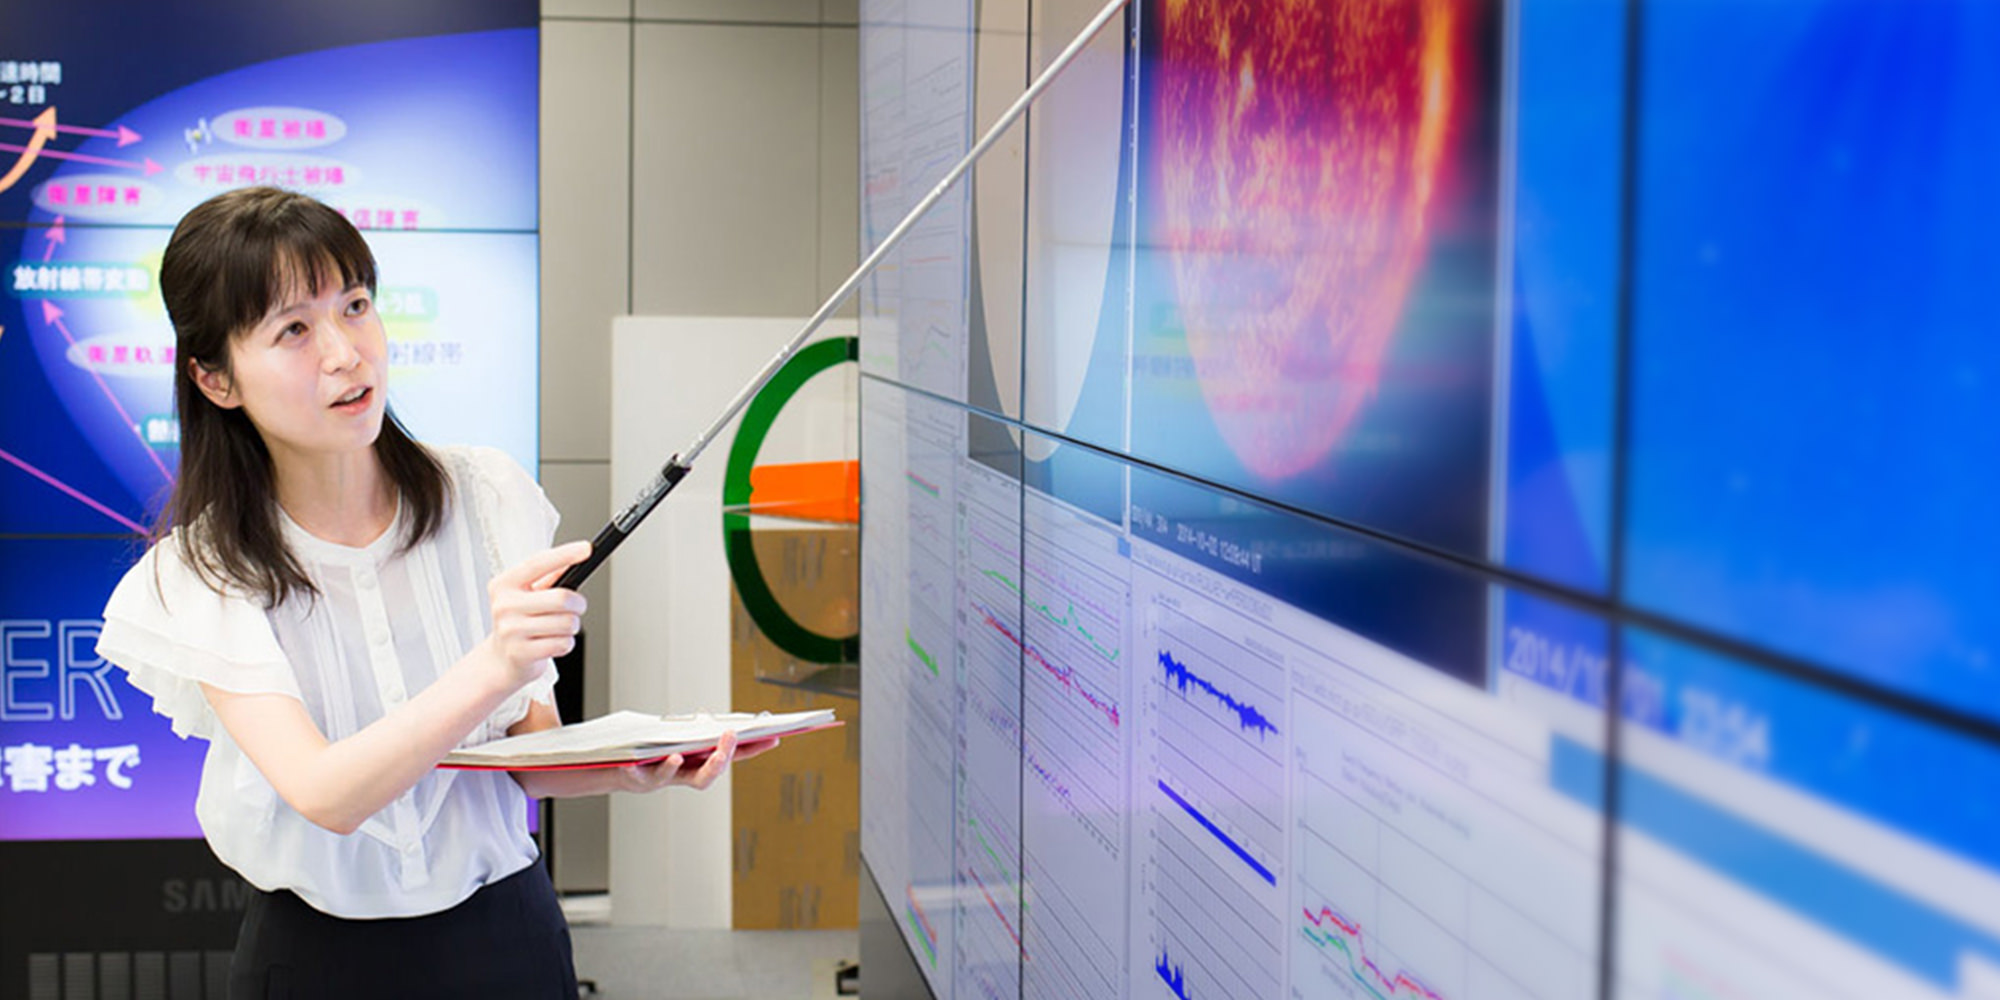
Senior Researcher Nakamizo checking the space weather forecast data.
- Home
- Researchers
- NAKAMIZO Aoi